Security Investment Business Case
EXECUTIVE SUMMARY
This business case requests approval of a $425,000 initial investment and $320,000 in annual operating costs to establish a systemwide franchisee security baseline program, complete an independent PCI DSS assessment across corporate and sampled franchised units, and execute enterprise data-processing addenda with the three mandated platform vendors. The program directly addresses the structural weakness exposed by the 2023 payment data incident at multiple franchised locations: 25-30 independent owner-groups, most with no IT staff and shared manager logins, control their own networks while any breach anywhere becomes a systemwide brand event overnight. In practice, the brand’s security is only as strong as its least secure operator.
Over three years, the program is projected to create approximately $2.56 million in quantified value through incident avoidance ($1.43 million), protection of the trust-sensitive revenue base ($697,000), operational efficiency gains from consolidated attestation and audit processes ($185,000), and reduction of stored-value gift card fraud exposure ($246,000). This yields a three-year return on investment of approximately 85% against a total cost of ownership of $1.39 million, with payback at roughly month 20. Because the largest value driver, the untreated incident probability, rests on a planning assumption rather than actuarial data, the conservative cases deserve equal attention: halving the modeled per-incident impact still yields roughly 33% ROI with payback in the third year, and a slower-than-modeled control effect still clears positive territory. The case does not depend on the optimistic end of its assumptions. These figures deliberately exclude revenue-enablement upside, such as accelerated franchise sales to security-conscious prospects, which is presented qualitatively rather than stretched into the financial model.
We recommend phased approval. Two decisions are deferred pending Year 1 data: competitive differentiation value cannot yet be credibly quantified, and operational resilience investments (cold-chain vendor contingency, marketplace outages) remain out of scope for this funding cycle.
1. BUSINESS OPPORTUNITY/CHALLENGE
- Business objective supported: Restore guest payment trust following the 2023 card-present data exposure, protect the brand promise that drives a 1M+ member loyalty database, and enable the stated growth strategy of expanding to 100+ units across six states without compounding per-unit security variance.
- Current situation: The company mandates the technology stack, collects fees for it, and owns the brand, but 25-30 independent owner-groups control their own networks, staff training, and local internet access. (These owner-groups operate roughly 40-50 franchised units, typically one or two units each, alongside roughly 10 corporate-owned units, for a systemwide total of 50-60.) Most owner-groups have no IT staff. Shared credentials persist across brand social accounts, the review-monitoring dashboard, and the learning management system, with departed managers’ access lingering for months. The 2023 POS malware skimming incident affected tens of thousands of guests across multiple franchised locations, with the brand bearing most of the public backlash while the franchisee bore the forensic bill. No systemwide security baseline or unit-level attestation program exists.
- Business opportunity: A demonstrable, independently validated security baseline converts the current structural liability into a trust asset. It shortens prospective-franchisee and vendor due diligence, strengthens the franchise value proposition in a market where competitors run ad-hoc security, and reduces the probability that a single franchisee’s network hygiene failure becomes the next systemwide brand event.
2. PROPOSED SECURITY INVESTMENT
- Solution overview: A three-part program: (1) an independent PCI DSS assessment covering the corporate entity plus a statistically representative sample of corporate and franchised units, closing the verification gap the 2023 incident revealed; (2) a lightweight franchisee security baseline program modeled on the checklists larger franchisors publish, consisting of shared-firewall requirements, quarterly attestation, POS terminal inspection logs, mandated MFA on back-office accounts, network password rotation, and a unit-level incident hotline, with compliance tied to royalty-incentive reviews; (3) enterprise data-processing addenda with the three mandated platform vendors (point-of-sale, digital ordering, and loyalty/CRM) covering breach-notification SLAs, subprocessor disclosure, and defined data-return and deletion terms for exiting franchisees.
- Implementation approach: Begin with a systemwide technology-standard bulletin (MFA, terminal inspection logs, password rotation) enforceable under existing franchise agreement authority, so momentum does not wait on the assessment. Build the attestation program and hotline in parallel. Run the PCI assessment in months 6 through 12 so findings feed Year 2 remediation planning. Negotiate vendor addenda concurrently, as counsel capacity, not technical readiness, is the pacing constraint. Franchisee rollout proceeds by region with a business consultant embedded to manage resistance, since the mandated-vendor rebate structure means some owners will read new requirements as the company profiting from their compliance. Two timeline cases apply to vendor addenda: base case (all three executed by month 12) and conservative case (one addendum slips to month 15).
- Timeline: Months 0-3: technology-standard bulletin issued, MFA rollout begins, outside counsel engaged for addenda and franchise agreement amendment. Months 3-9: baseline program build, attestation portal launch, hotline live. Months 6-12: independent PCI DSS assessment of corporate and sampled units. Months 9-12: vendor addenda executed (base case); months 9-15 (conservative case). Month 12 onward: steady-state operation, attestation compliance reporting, Year 2 remediation scoping.
3. BUSINESS VALUE FRAMEWORK
A. REVENUE ENABLEMENT
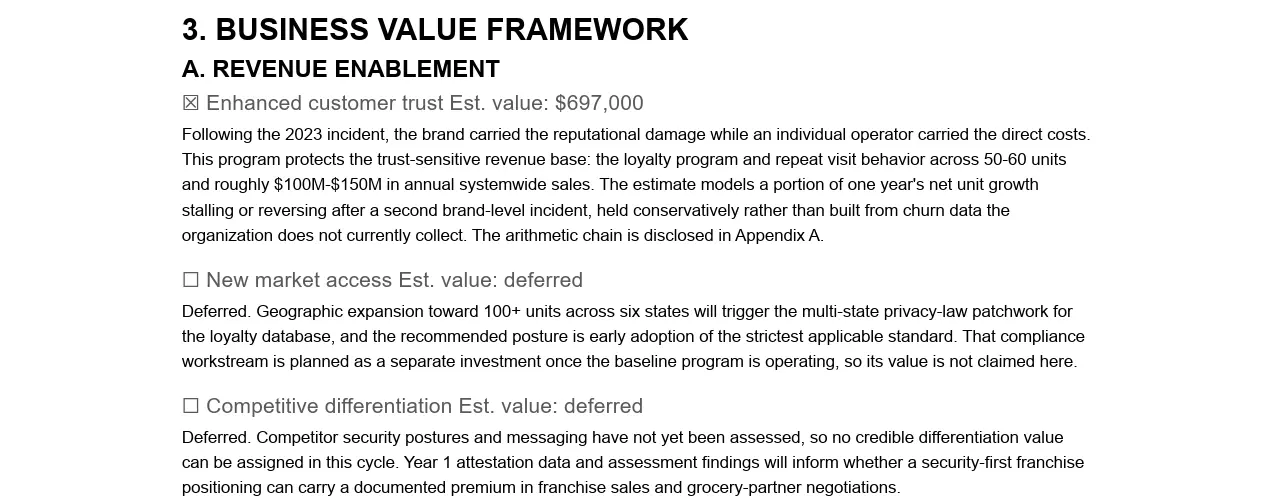
☒ Enhanced customer trust Est. value: $697,000
Following the 2023 incident, the brand carried the reputational damage while an individual operator carried the direct costs. This program protects the trust-sensitive revenue base: the loyalty program and repeat visit behavior across 50-60 units and roughly $100M-$150M in annual systemwide sales. The estimate models a portion of one year’s net unit growth stalling or reversing after a second brand-level incident, held conservatively rather than built from churn data the organization does not currently collect. The arithmetic chain is disclosed in Appendix A.
☐ New market access Est. value: deferred
Deferred. Geographic expansion toward 100+ units across six states will trigger the multi-state privacy-law patchwork for the loyalty database, and the recommended posture is early adoption of the strictest applicable standard. That compliance workstream is planned as a separate investment once the baseline program is operating, so its value is not claimed here.
☐ Competitive differentiation Est. value: deferred
Deferred. Competitor security postures and messaging have not yet been assessed, so no credible differentiation value can be assigned in this cycle. Year 1 attestation data and assessment findings will inform whether a security-first franchise positioning can carry a documented premium in franchise sales and grocery-partner negotiations.
B. COST OPTIMIZATION
☒ Operational efficiency Est. value: $185,000
Consolidated quarterly attestation, standardized security requirements, and a single systemwide PCI assessment replace the duplicated, inconsistent security questionnaires and remediation work each brand initiative currently absorbs. Modeled as roughly $90,000 per year at steady state, ramping with program maturity.
☒ Incident avoidance Est. value: $1,435,000
The core of the business case. Modeled on an annual untreated recurrence probability of 40%, reduced to approximately 12% once MFA, terminal inspection, credential hygiene, and network baselines are in force across all units, and a per-incident impact of $2.5 million. The 40% untreated probability is a planning assumption, not an actuarially certified frequency: it draws on industry multi-breach prevalence adjusted upward for the weak-link franchise structure, and the treated-probability sensitivity case is the more defensible bound for executive review. The impact figure is a conservative discount to published industry breach-cost benchmarks, reflecting that franchise payment incidents at this record volume typically land below all-industry averages. Value ramps at 30% in Year 1, 75% in Year 2, and 100% in Year 3 as controls take effect. This deliberately treats the forensic bill allocation problem discovered in 2023, where costs landed on the franchisee while damage landed on the brand, as an avoided-systemic-risk event rather than a transfer.
☐ Compliance streamlining Est. value: deferred
Deferred. Anticipated savings from shared controls across multiple compliance frameworks are expected to materialize beginning in Year 2, after the baseline attestation data exists to measure them. Claiming them now would double-count against the operational efficiency line.
C. RISK MITIGATION
☒ Financial risk reduction Est. value: $246,000
Stored-value gift card balances on a third-party issuing platform are a standing target for fraud rings testing small-balance cards across all units. Hardened authentication, monitoring, and vendor breach-notification SLAs are modeled to reduce gift card fraud losses by roughly $120,000 per year at steady state.
☐ Reputational protection Est. value: tracked in Revenue Enablement (Enhanced customer trust line)
The brand is the asset at risk: a breach at any of 50-60 units becomes a systemwide event overnight, as 2023 proved. Value is captured once in the Revenue Enablement trust line to avoid double-counting. This line is addressed but not assigned a standalone number; the checkbox indicates treatment rather than a discrete value claim.
☐ Operational resilience Est. value: $0 this cycle
Out of scope. Cold-chain supplier contingency, marketplace delivery outages, and broadline distributor failure modes are real exposures but fall outside this program’s mandate. Flagged for a future investment decision once the baseline program demonstrates the attestation machinery that would govern supplier-facing controls.
Note on value lines: checked lines (☒) carry standalone quantified value claims; unchecked lines (☐) are either deferred to future periods or addressed without standalone valuation (as with Reputational protection, which is captured elsewhere).
4. INVESTMENT DETAILS
• Initial investment: $425,000
• Ongoing annual costs: $320,000
• Total 3-year TCO: $1,385,000
| Initial investment component | Amount |
|---|---|
| Independent PCI DSS assessment (corporate entity plus sampled units) | $120,000 |
| Franchisee security baseline program build (checklist, attestation portal, incident hotline) | $85,000 |
| Outside counsel: vendor data-processing addenda and franchise agreement amendment | $70,000 |
| Remediation subsidy (MFA rollout, network hardening, terminal inspection tooling; 50-60 units; franchisee co-funding assumed at 50%) | $150,000 |
| Total initial investment | $425,000 |
| Ongoing annual cost component | Amount (per year) |
|---|---|
| Fractional security program lead retainer (0.4 FTE, ~69 hours per month, roughly 825 hours annually, at a blended rate of ~$230 per hour) | $190,000 |
| Annual PCI re-assessment | $65,000 |
| Attestation administration, audit sampling, hotline, monitoring (annual amount; attestation cadence is quarterly) | $65,000 |
| Total ongoing annual costs | $320,000 |
Build-up of the $65,000 annual administration line: franchise business consultant at 0.2 FTE (approximately 415 hours per year) allocated from existing staff at an internal allocation rate of $50 per hour ($20,750); corporate IT engineer at 0.25 FTE (approximately 520 hours per year) at the same internal allocation rate ($26,000); attestation platform subscription, hotline maintenance, and monitoring tooling ($18,250). Internal communications support is treated as absorbed overhead under existing marketing headcount and does not appear in the TCO. Because the consultant and engineer are allocations of existing salaried staff rather than incremental hires, the internal allocation rate reflects marginal cost, not market replacement cost.
5. EXPECTED RETURNS
• Total 3-year value created: $2,563,000
• ROI (3-year): 85%
• Payback period: 20 months
• Additional non-financial benefits: Shorter prospective-franchisee and grocery-retail-partner due diligence cycles; consistent brand protection across corporate and franchised units regardless of local IT maturity; reduced franchisee anxiety around the AI drive-thru pilot’s data handling once vendor secondary-use terms are locked; a defensible answer to card-brand and insurer questions that currently have none; retained leverage in data-ownership disputes with departing franchisee groups, since access terms will be contractually defined rather than contested.
Note on rounding: narrative figures in this document round to the nearest $0.01 million; table figures round to the nearest $1,000. Minor discrepancies between exact multiplication (e.g., 75% × $90,000 = $67,500) and displayed values (e.g., $68,000) reflect this convention and do not affect totals beyond ±$500 per cell. All inputs, including per-incident impact, contribution margins, and unit-growth assumptions, are round-number planning estimates; the precision of the totals should not be overread.
| Value category | Year 1 | Year 2 | Year 3 | 3-year total |
|---|---|---|---|---|
| Incident avoidance | $210,000 | $525,000 | $700,000 | $1,435,000 |
| Enhanced customer trust (revenue protection) | $102,000 | $255,000 | $340,000 | $697,000 |
| Operational efficiency | $27,000 | $68,000 | $90,000 | $185,000 |
| Gift card fraud reduction | $36,000 | $90,000 | $120,000 | $246,000 |
| Total | $375,000 | $938,000 | $1,250,000 | $2,563,000 |
Value ramps at 30% / 75% / 100% of steady state across the three years, reflecting that controls take effect only after rollout. Two conservative cases bound the base case: halving the per-incident impact to $1.25 million reduces three-year value to approximately $1.85 million, ROI to roughly 33%, with payback early in the third year; raising treated probability to 20% yields approximately 55% ROI. The case clears positive territory in both, which is why the remediation subsidy phase gates are tied to attestation compliance rather than calendar dates and why the conservative cases are presented alongside the base case rather than buried in an appendix.
6. STRATEGIC ALIGNMENT
This investment operationalizes the growth strategy’s own sequencing. The short-term actions already identified by leadership, the systemwide technology-standard bulletin, the legal settlement of franchisee data-ownership terms, and the pause on AI pilot expansion, all depend on infrastructure this program funds. The medium-term franchisee security baseline and the independent PCI assessment are this program’s core deliverables. The long-term ambition of 100+ units across six states cannot be pursued responsibly while security posture varies unit by unit; every new franchise added before the baseline exists widens the attack surface without adding a corresponding control.
The program also maps cleanly onto the four dimensions of the Security Business Enablement Matrix. It delivers operational enablement by keeping systems running across all units with hardened, monitored infrastructure; trust creation by protecting the loyalty relationship and giving sales, marketing, and franchise development teams a security story they can tell with substance rather than theater; compliance advantage by converting a mandated PCI obligation into a single systemwide framework with shared controls instead of fragmented, duplicative unit-level efforts; and innovation support by establishing the risk guardrails within which the AI drive-thru pilot and future pilots can proceed on signed terms rather than open-ended exposure.
Financially, the model respects the dual-sided revenue structure. Corporate units and franchised units both pay into the outcome through existing royalty and technology-fee mechanisms. Against the midpoint of the estimated $15M-$25M annual franchisor revenue band (roughly $20 million), the $320,000 annual run rate represents approximately 1.6% of franchisor revenue and is absorbable without a new fee category in Year 1. Whether attestation costs migrate partially into the technology-fee base after Year 2 is an open question deferred to the franchise agreement amendment.
7. IMPLEMENTATION CONSIDERATIONS
- Key dependencies: Franchisee cooperation, the single largest dependency; the mandated-vendor rebate conflict means some owner-groups will resist requirements perceived as company profit from their compliance, making the royalty-incentive linkage and embedded business consultant essential. Execution of the franchise agreement amendment codifying the guest database as brand-owned and franchisee-licensed, with defined access during and after termination, since departing groups have already disputed access to their customers. Vendor cooperation on data-processing addenda from the point-of-sale, digital ordering, and loyalty platforms, none of which currently owe breach-notification SLAs. Outside counsel capacity of roughly 250-300 hours. AI drive-thru pilot resolution, with voice-data retention, consent signage, and secondary-use prohibitions remaining unsigned; this stays outside the funded scope but is listed as a dependency because its outcome shapes the data-governance language in the same addenda.
- Resource requirements: Fractional security program lead, 0.4 FTE (~69 hours per month), retained; corporate IT engineer, 0.25 FTE (~520 hours per year), for MFA and back-office rollout; external QSA firm, engagement-based annually; outside counsel, approximately 250-300 hours; franchise business consultant, 0.2 FTE (~415 hours per year), for change management and attestation adoption; internal communications support for the technology-standard bulletin rollout across all units. All roles except the fractional lead are funded within the $65,000 annual administration line item in the ongoing costs table; internal communications support is absorbed overhead.
- Key stakeholders: Corporate executive leadership and board; franchisee association leadership, whose endorsement determines adoption velocity; outside counsel; the insurance captive administrator, whose loss history will benefit from documented controls; the card brands and acquirer, through the PCI assessment; platform vendors party to the addenda; the internal audit or finance function receiving attestation reporting.
- Success metrics: Untreated annual incident probability reduced from modeled 40% toward 12%, evidenced by zero systemwide brand-level incidents; quarterly attestation compliance at or above 85% of units by month 12, with regional phase-in targets; MFA coverage at 100% of back-office accounts across all units by month 6; time to revoke departed manager access reduced from months to days; unit-level hotline response time under 4 hours for suspected incidents; gift card fraud write-offs trending downward against the Year 0 baseline; attestation data quality sufficient by month 12 to revisit the deferred competitive differentiation and compliance streamlining value lines with defensible numbers.
8. RECOMMENDATION
Approve the full program: $425,000 initial and $320,000 annual ongoing, three-year TCO of $1,385,000, projected three-year value of $2,563,000, ROI of 85%, payback at 20 months, with the conservative bounds (roughly 33% to 55% ROI depending on assumption set) disclosed alongside rather than behind the headline. Proceed in phases tied to gates rather than dates: the PCI assessment proceeds regardless, since it exposes the true current state the 2023 incident only hinted at; the remediation subsidy releases in tranches as regional attestation participation clears the 85% threshold, protecting the budget from the realistic possibility that a minority of owner-groups resist.
Two items require explicit acknowledgment. First, the deferred lines are deliberate, not oversights: competitive differentiation, new market access through multi-state compliance, compliance streamlining savings, and operational resilience are all excluded from the financial model because credible numbers do not yet exist, and inflating them would hand skeptics the easiest possible argument against approval. Second, this program does not solve the structural accountability mismatch the 2023 incident exposed, where the entity profiting from the mandated technology stack bore none of the incident response costs; the franchise agreement amendment narrows it, but full resolution requires revisiting the forensic-cost allocation in franchise renewals, a fight leadership should expect in Year 2 and should not paper over now.
The alternative, declining or deferring, carries an untreated recurrence probability near 40% annually against a $2.5 million per-event impact, producing roughly $1 million in expected annual loss. Under the proposed program, the total annual economic burden is the $320,000 run rate plus approximately $300,000 in residual expected loss (12% × $2.5 million), totaling approximately $620,000. The margin between status quo and proposed is therefore roughly $380,000 annually, narrower than a naive comparison would suggest but still decisively positive, and the gap widens each year the program operates as franchise growth compounds the exposure it prevents. Waiting a year does not make the program cheaper; it adds another year of the weakest-link exposure at a larger unit count.
©Kayne McGladrey – Get the full book “Cyber Risk is a Myth”