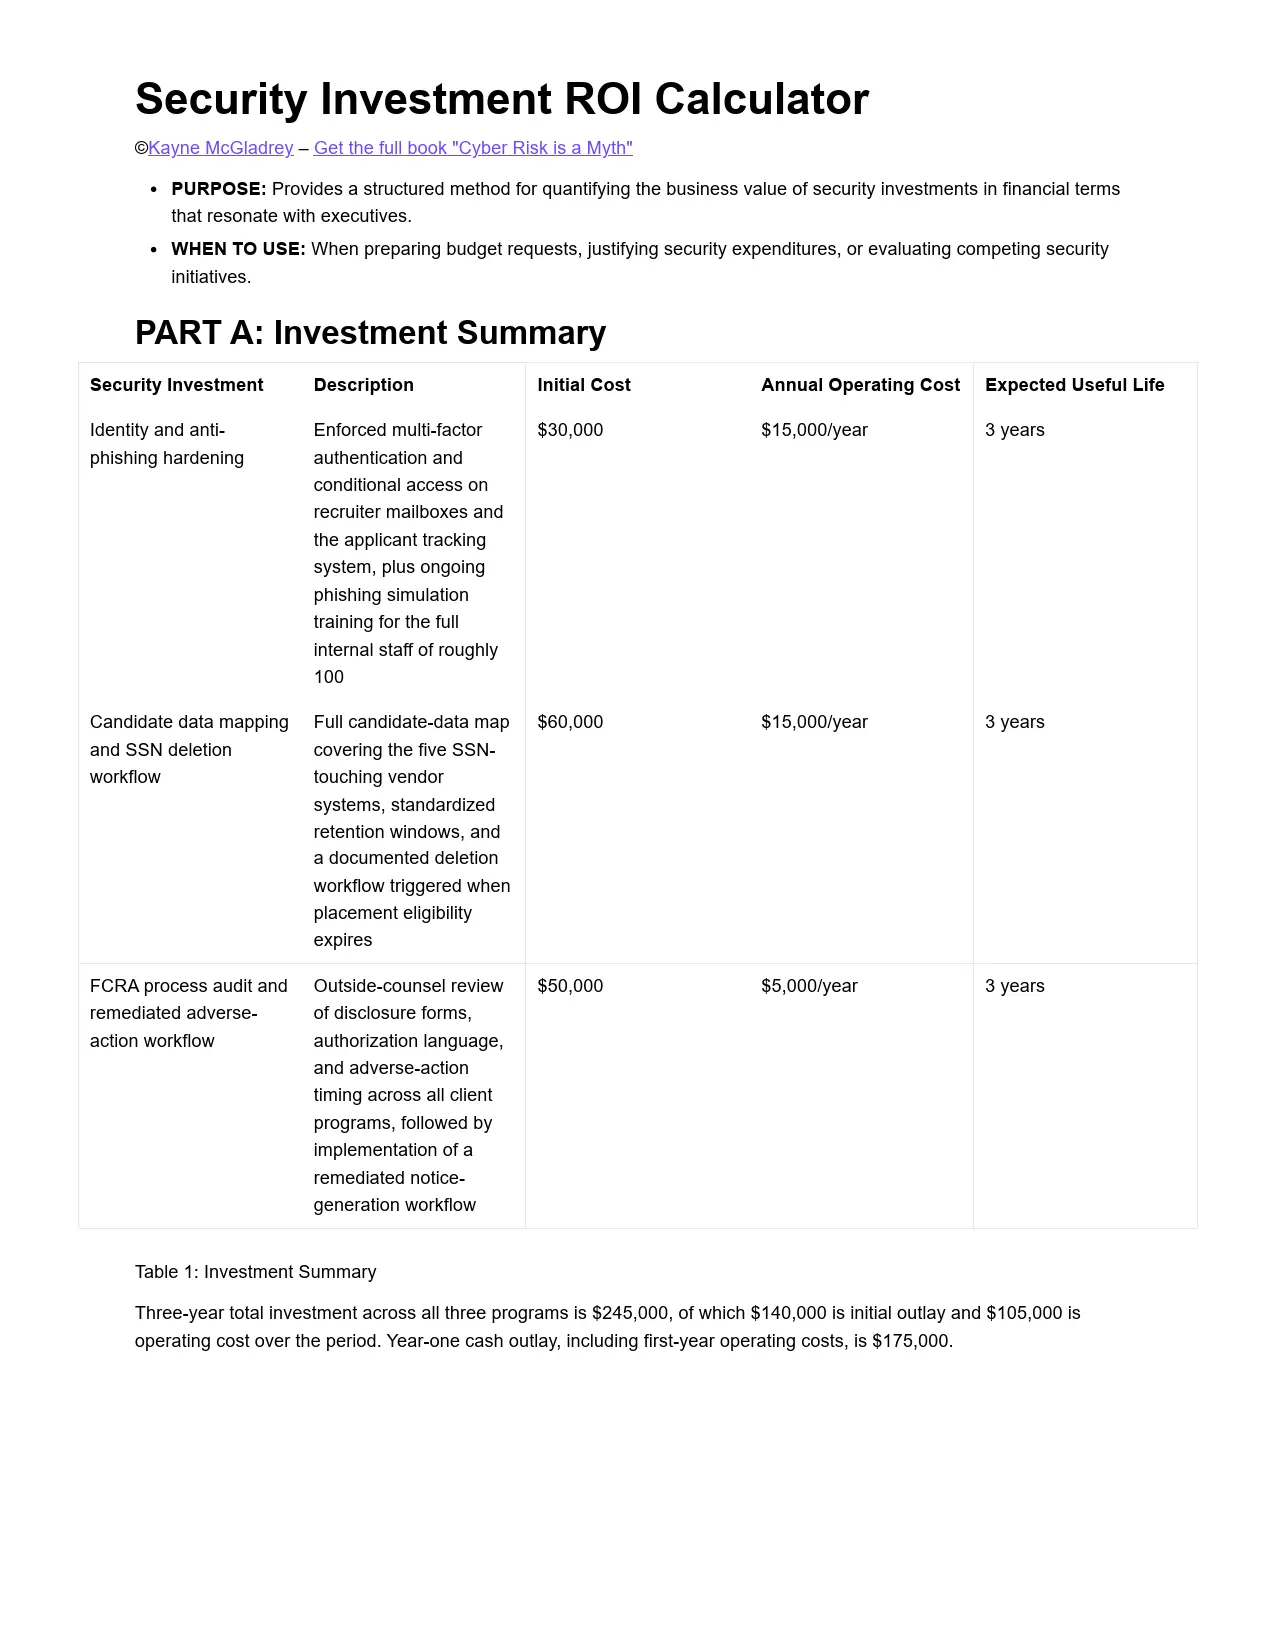
Security Investment ROI Calculator
©Kayne McGladrey – Get the full book “Cyber Risk is a Myth”
- PURPOSE: Provides a structured method for quantifying the business value of security investments in financial terms that resonate with executives.
- WHEN TO USE: When preparing budget requests, justifying security expenditures, or evaluating competing security initiatives.
PART A: Investment Summary
| Security Investment | Description | Initial Cost | Annual Operating Cost | Expected Useful Life |
|---|---|---|---|---|
| Identity and anti-phishing hardening | Enforced multi-factor authentication and conditional access on recruiter mailboxes and the applicant tracking system, plus ongoing phishing simulation training for the full internal staff of roughly 100 | $30,000 | $15,000/year | 3 years |
| Candidate data mapping and SSN deletion workflow | Full candidate-data map covering the five SSN-touching vendor systems, standardized retention windows, and a documented deletion workflow triggered when placement eligibility expires | $60,000 | $15,000/year | 3 years |
| FCRA process audit and remediated adverse-action workflow | Outside-counsel review of disclosure forms, authorization language, and adverse-action timing across all client programs, followed by implementation of a remediated notice-generation workflow | $50,000 | $5,000/year | 3 years |
Table 1: Investment Summary
Three-year total investment across all three programs is $245,000, of which $140,000 is initial outlay and $105,000 is operating cost over the period. Year-one cash outlay, including first-year operating costs, is $175,000.
PART B: Risk Reduction Value
| Risk Type | Business Asset Protected | Asset Value at Risk | Risk Reduction % | Annualized Value Protected |
|---|---|---|---|---|
| Data breach of candidate database | 200,000+ candidate records, the employer brand promise, and the two-sided client/candidate trust relationship | $2,250,000 (range $1,900,000 to $2,600,000) | 50% (range 35% to 60%) | $281,250 |
| FCRA class action arising from adverse-action procedural defects | Background screening service line serving thousands of checks annually across roughly 150 client programs | $1,900,000 (range $800,000 to $3,000,000) | 80% (range 70% to 90%) | $228,000 |
| Right-to-delete coordination failure across five SSN-touching vendors | 200,000+ candidate records scattered across vendor systems with differing retention windows | $250,000 to $750,000 in combined penalties and remediation per enforcement action once multistate privacy regimes bind; expected annual value $12,500 to $37,500 at below-5% likelihood in the current single-state footprint, excluded from headline totals | Up to 90% once the two outstanding vendor deletion SLAs are executed; approximately 60% today, with three of five vendors under signed deletion terms | Carried as efficiency value in Part D; re-baselined upon first new-state registration |
Table 2: Risk Reduction Value
The breach impact estimate is built from three components: settlement exposure of $200,000 to $400,000 using realized per-class-member payouts from comparable SSN breaches, direct incident response costs of roughly $200,000, and business loss of $1.5M to $2.0M reflecting client attrition against annual revenue of $30M to $40M. Probabilities are presented as ranges with midpoints used for computation: 20% to 30% annual likelihood of a repeat breach (midpoint 25%), set by post-incident assessment given that a phishing-enabled compromise of the prior incident’s attack vector has already occurred once at this firm and sector litigation patterns show an active plaintiff bar; and 10% to 20% annual likelihood of an FCRA class claim (midpoint 15%), set from observed settlement frequency among employers running background-check programs at comparable volumes. For breach exposure, the multi-factor and conditional access controls address the credential-abuse attack vector implicated in the prior incident; residual risk reflects the phishing simulation program’s inability to eliminate all human-factor compromise, which is why the reduction estimate is held at 50% rather than the 60% achievable for unauthorized access to data and financial systems alone.
PART C: Business Enablement Value
| Business Initiative Enabled | Value of Initiative | Security Contribution | Value Attribution |
|---|---|---|---|
| AI-assisted candidate matching | Order-of-magnitude placeholder: $500,000 to $1,500,000 in placement velocity gains, pending attribution study | Bias-audit cadence, human-review checkpoints, and candidate disclosure language delivered as a precondition for rollout to multistate clients | $0, deferred until the attribution study completes at the end of the second quarter of next fiscal year; metric to be measured: reduction in days-to-fill and increase in match quality scores |
| Employer-of-record expansion to additional states | Order-of-magnitude placeholder: $1,000,000 to $3,000,000 in expanded contractor payroll revenue across new jurisdictions, pending state registrations | Candidate-data map, deletion workflow, and vendor breach-notification SLAs satisfy the data-governance prerequisites for entering new state privacy regimes | $0, deferred until the first new-state registration or annual review, whichever comes first; metric to be measured: gross payroll dollars entered in new state |
Table 3: Business Enablement Value
Attribution of dollar value to these initiatives is deferred to the stated milestones rather than open-endedly. Both depend on externally paced events, client-side rollout decisions for the matching tool and state-by-state registration sequencing for employer-of-record expansion, and assigning premature figures would undermine the credibility of the rest of this analysis. Placeholder ranges represent management estimates awaiting the attribution study and registration sequencing confirmation.
PART D: Operational Efficiency Value
| Process Improved | Previous Cost | New Cost | Annual Savings | Useful Life | Total Value |
|---|---|---|---|---|---|
| Candidate deletion and access request fulfillment across five SSN-touching vendors (deletion SLAs still pending with two of the five) | $170,000/year | $40,000/year | $130,000/year at full integration; run-rate gates on executing the two outstanding SLAs, targeted for next quarter | 3 years | $390,000 |
| Adverse-action notice generation and compliance rework across client programs | $35,000/year | $15,000/year | $20,000/year | 3 years | $60,000 |
| Subtotals by attributing program | $450,000 total efficiency savings, of which $390,000 is attributed to the data-mapping stream and $60,000 migrates to the FCRA/Risk-Reduction line in Table 5 |
Table 4: Operational Efficiency Value
Request volume is estimated at 115 requests annually, benchmarked against deletion and access request rates for a database of this size, with manual fulfillment previously averaging approximately $1,475 per request (derived average, calculated as $170,000 ÷ 115), across internal coordination and the five vendors. The adverse-action savings are generated by the FCRA audit investment and are therefore counted with that program’s value in Part E rather than with the data-mapping stream.
PART E: ROI Calculation
| Investment Category | Total Investment (3-year) | Total Value (3-year) | ROI | Payback Period |
|---|---|---|---|---|
| Risk Reduction | $140,000 | $1,587,750 | 1,034% | 1.9 months |
| Business Enablement | $0 direct; rides on the data-mapping and FCRA investments attributed to other categories | Placeholder ranges in Table 3; risk-adjusted value not applicable until milestones achieved | Not quantified | Not quantified |
| Operational Efficiency | $105,000 | $390,000 | 271% | 5.5 months |
| TOTAL | $245,000 | $1,977,750 | 709% | 2.7 months |
Table 5: ROI Calculation
Risk Reduction value combines $843,750 in breach exposure reduction, $684,000 in FCRA claim avoidance, and the $60,000 in adverse-action process savings attributable to the FCRA program. ROI compares three-year value against three-year total investment. Payback is measured as initial outlay against first-year annualized value assuming no ramp-up, with initial outlays of $80,000 for Risk Reduction, $60,000 for Operational Efficiency, and $140,000 in total, against first-year annualized values of $529,250, $130,000, and $659,250 respectively.
Two alternative bases apply: on the year-one cash outlay of $175,000, total payback is 3.2 months; on the stricter full three-year investment of $245,000, paybacks lengthen to 3.4 months for Risk Reduction, 9.7 months for Operational Efficiency, and 4.5 months total. Because the identity program includes behavioral controls that require adoption across roughly 100 staff, a six-month linear ramp to full efficacy extends total payback from 2.7 to approximately 5.4 months.
Part F: Risk-Adjusted ROI
| Investment Category | Total Investment (3-year) | Total Value (3-year) | ROI | Payback Period |
|---|---|---|---|---|
| Risk Reduction | $140,000 | $916,650 | 555% | 3.0 months |
| Business Enablement | $0 direct; rides on the data-mapping and FCRA investments attributed to other categories | Placeholder ranges in Table 3; risk-adjusted value not applicable until milestones achieved | Not quantified | Not quantified |
| Operational Efficiency | $105,000 | $382,500 | 264% | 6.5 months |
| TOTAL | $245,000 | $1,299,150 | 430% | 3.9 months |
| Low-End Sensitivity | $245,000 | $837,000 | 242% | Inside seven months |
Table 6: Risk-Adjusted ROI Calculation
Risk-Adjusted ROI: Value components are weighted by estimate type: the risk-reduction components ($843,750 breach exposure reduction plus $684,000 FCRA claim avoidance, totaling $1,527,750) are discounted to 60% because they compound three uncertain quantities, incident probability, impact, and control effectiveness; the efficiency components ($390,000 deletion savings plus $60,000 adverse-action savings, totaling $450,000) are weighted at 85% because they rest on firmer per-request cost data. This yields $916,650 plus $382,500, a risk-adjusted three-year value of approximately $1,299,150 and a risk-adjusted ROI of 430%.
At the low end of every ranged input (breach impact $1.9M, 20% probability, 35% reduction; FCRA impact $800,000, 10% probability, 70% reduction; efficiency savings at 60% of central estimate), three-year value is approximately $837,000 and ROI is 242%, with payback inside seven months, so the investment clears any reasonable hurdle rate even at the pessimistic bound.
Non-Quantifiable Benefits:
- Enhanced regulatory standing ahead of multistate employer-of-record expansion
- Demonstrable data-governance record and clean litigation posture supporting eventual acquisition positioning
- Preserved employer brand promise around careful candidate vetting, protecting both sides of the placement relationship
- Candidate trust and repeat-application behavior across the 200,000+ record database
- Reduced risk of payroll funding disruption at the lending institution that finances weekly contractor payroll
- Improved security culture among recruiters handling SSN-bearing onboarding documents
IMPLEMENTATION TIPS:
- Collaborate with Finance to validate calculation methodologies and assumptions
- Use ranges rather than point estimates when precise values are unavailable
- Document all assumptions to maintain credibility and enable future refinement